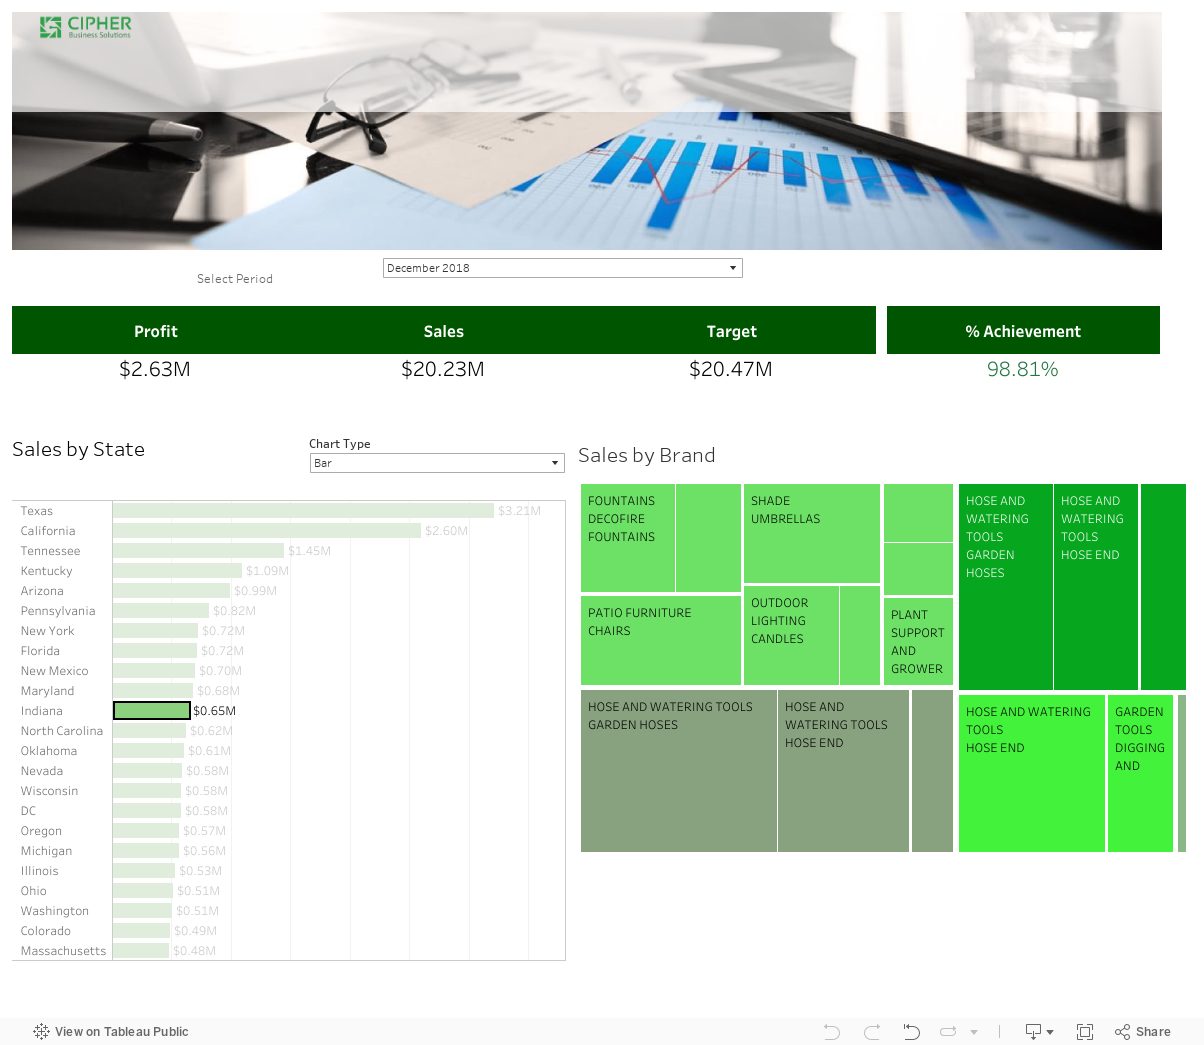
What is Tableau?
Tableau is a business intelligence software used to deliver powerful visualizations and provide users with self-service options where they can load information and create their own reports and dashboards.
Tableau in the Business Intelligence world
Tableau was created by a company called “Tableau Software” and it revolutionized the Business Intelligence field with its intuitive functionality. That means users were able to create visualizations, included their beloved maps, with minimum to no IT involvement.
What initially was a project within the Stanford Computer Science department was quickly adopted by many organizations in different industries.
Products available
There are different “flavors” of Tableau, including Desktop, Server, Online and Public. These options offer flexibility for customers that want to deploy it On-Premise or Cloud.
Organizations can install and maintain the server on-site or can delegate that by going with the option hosted by Tableau.
Desktop is the software installed on the users’ computers to build the visualizations.
Once the reports and dashboards have been build those can be publish to the server so other users can consume the information.
Key steps to create a visualization
- Connect to the source(s): Tableau offers the ability to connect to one or multiple sources and this can be done with live connection, performing a Data Extract or a combination of those two.
- Prepare your connections: Create the joins, merge data, create formulas, etc. to enhance the source data and make it easier for the end users.
- Soles and security: make sure the right data get to the right people.
- Visualize: create the analytics, apply formulas on the fly, and configure filters in a simple way.
- Share: collaborate with others and share the story.
Tableau's Difference
Without a doubt one of the main benefits is the ease of use.
Because of this, and the licensing structure, it can be purchase and adopted by a single department in the organization and then expand the footprint internally.
Tableau was one of the first tools to offer Geo-map functionality in a simple way, identifying geographical elements in the data or just taking the latitude and longitude parameters to plot the numbers on a map.
The company has created a lot of material to make sure organizations use the tool the best way. This includes training material, sample dashboards, webinars and other resources so users can get and share ideas and best practices.
Public option
There is a free version of Tableau which is the Public edition.
This one offers an option for everyone to get a taste of the application with limited functionality.
Users are not able to connect to databases and everything that is done is available in Tableau’s public server.
This is a great option to practice visualizations and it is also a great asset for public sector organizations when their data is already public.
Download Tableau Public Sector Case Study.
Cipher’s Experience
A tool offering this kind of flexibility requires well defined strategy to allow it to grow incrementally within the organization.
Many times customers require an Enterprise Data Warehouse that could guarantee a single version of the truth and improve the access from the sources.
Additionally, depending on the characteristics of the sources and the amount of data, users could run into performance issues that require additional assistance for modeling and data processes to improve the user experience.
Last but not least, many users require the right training based on their roles and the type of information they handle.
Cipher has a vast experience dealing with this and other scenarios.
Contact us to know more about how our certified consultants can help in your specific case.